[情报] 两极海冰月追踪-2017/10
楼主: keroromoa (发言要小心 避免踩到陈雷) 2017-10-10 16:00:15
http://nsidc.org/arcticseaicenews/
资料来源:美国国家冰雪资料中心
最后更新日期:2017/10/5
Arctic sea ice 2017: Tapping the brakes in September
北极海冰2017现况:融冰速度踩煞车的九月
After setting a record low seasonal maximum in early March, Arctic sea ice
extent continued to track low through July. However, the rate of ice loss
slowed in August and September. The daily minimum extent, reached on
September 13, was the eighth lowest on record, while the monthly average
extent was seventh lowest. In Antarctica, sea ice extent may have reached its
annual winter maximum.
北极海冰在三月初达到破纪录新低的最大面积后,开始稳定缩减至七月。然而在八到九月
北极海冰消融的速度放缓,在9/13达到最小面积(此为历史第八低,而九月平均面积为历
史第七低)。在南极,海冰面积可能已达到冬天最大值。
Overview of conditions 现况概述
Arctic sea ice extent for September 2017 averaged 4.87 million square
kilometers (1.88 million square miles), the seventh lowest in the 1979 to
2017 satellite record. This was 1.67 million square kilometers (645,000
square miles) below the 1981 to 2010 average, and 1.24 million square
kilometers (479,000 square miles) above the record low September set in 2012.
北极海冰面积九月平均为487万平方公里(188万平方英里),为自1979年以来历史第七
低。和1981至2010平均相比少了167万平方公里(64.5万平方英里),而比历史最低的2012
年九月多了124万平方公里(47.9万平方英里)。
After reaching the minimum on September 13 (eighth lowest on record), extent
initially increased slowly (about 20,000 square kilometers, or 8,000 square
miles, per day). However, starting September 26 and persisting through the
end of the month, ice growth rates increased to about 60,000 square
kilometers (23,000 square miles) per day. During the second half of the
month, extent increased in all sectors except in the Beaufort Sea, where some
local ice retreat persisted. The most rapid growth occurred along the
Siberian side of the Arctic Ocean, where the ice edge advanced as much as 150
kilometers (90 miles) over the latter half of September. At the end of
September, the ice edge in the Beaufort and Chukchi Seas remained
considerably further north than is typical.
在9/13达到(历史第八低的)最小面积后,北极海冰面积开始(以约每天2万平方公里,
8000平方英里速度)缓慢增加。但是从9/26开始至月底,速度加快至每天6万平方公里(
2.3万平方英里)。在后半月,除了波佛特海仍有冰层消退,其余地方结冰面积皆开始增
加。西伯利亚是增加最快的地方,冰层边缘长度在后半月增加将近150公里(90英里)。
在九月底,波特佛海和楚科奇海的冰层边缘离正常位置仍北了许多。
https://goo.gl/kEwJr5
Near-record open water reported in Beaufort and Chukchi seas
波佛特海和楚科奇海的未结冰水域面积已逼近历史纪录
![]()
Figure 1. Arctic sea ice extent for September 2017 was 4.87 million square
kilometers (1.88 million square miles). The magenta line shows the 1981 to
2010 average extent for that month. Sea Ice Index data. About the data
图1. 北极海冰面积在九月为487万平方公里(188万平方英里)。红紫色为1981至2010九月
同期的平均面积。
Conditions in context 详细现况
September air temperatures at the 925 hPa level (approximately 2,500 feet
above sea level) were above average over much of the Arctic Ocean.
Temperatures ranged from 5 degrees Celsius (9 degrees Fahrenheit) above the
1981 to 2010 long term average in the far northern Atlantic east of
Greenland, to 1 to 2 degrees Celsius (2 to 4 degrees Fahrenheit) above the
reference period in the western Arctic. Cooler conditions (1 degree Celsius
or 2 degrees Fahrenheit below average) were present in Baffin Bay. Part of
the above average temperatures over the coastal areas of the Arctic Ocean and
in the northern North Atlantic likely results from heat fluxes from open
water.
北极海多数地方九月925百帕层(约海拔2500英呎)的温度皆高于平均。格陵兰东北方海域
比1981至2010年平均高了摄氏5度(华氏9度),北极海西部高了摄氏1~2度(华氏2~4
度)。巴芬湾则为负距平(低了摄氏1度,华氏2度)。在北极海与北大西洋北方部分区域
的正距平造成热通量进而导致仍有未结冻水域的产生。
Looking back at this past summer (June through August), air temperatures at
the 925 hPa level averaged for June through August were near or below the
1981 to 2010 average over much of the Arctic Ocean, notably along the
Siberian side centered over the Laptev Sea (1 degree Celsius or 1.8 degrees
Fahrenheit below the 1981 to 2010 average). By contrast, temperatures were
slightly above average over much of the East Siberian, Chukchi and Beaufort
Seas (1 degree Celsius, or 1.8 degrees Fahrenheit above average).
六至八月,925百帕层的温度将近或低于1981至2010年平均,特别是在西伯利亚的拉普捷夫
海(低于摄氏1度,华氏1.8度)。相对地,东西伯利亚、波佛特海与楚科奇海则略高于平
均(摄氏1度,华氏1.8度)。
Like 2016, the summer of 2017 was characterized by persistently stormy
patterns over the central Arctic Ocean, reflected in the summer average sea
level pressure field (Figure 2b) as an area of low pressure centered just
south of the North Pole in the Siberian sector of the Arctic. As has been
shown in past studies, low pressure systems found over the central Arctic
Ocean in summer are typically “cold cored.” This helps to explain the cool
summer temperatures noted above. The cyclonic (counterclockwise) winds
associated with the stormy pattern also tend to spread out the sea ice. Both
processes likely helped to slow sea ice loss this summer.
如同2016年,2017年夏天北极海中心为暴风型,反映出夏天平均环境场为低压中心,除了
北极海南部的西伯利亚扇形区域。过去研究显示,低压环境场在夏天常为典型冷源。这帮
助解释凉夏的原因。逆时针环流除了和暴风型态有关也有助于扩张海冰。两者都可能帮助
减缓夏天海冰消融速度。
![]()
Figure 2a. The graph above shows Arctic sea ice extent as of October 4, 2017,
along with daily ice extent data for five previous years. 2017 is shown in
blue, 2016 in green, 2015 in orange, 2014 in brown, 2013 in purple, and 2012
in dotted brown. The 1981 to 2010 median is in dark gray. The gray areas
around the median line show the interquartile and interdecile ranges of the
data. Sea Ice Index data.
图2a. 至2017/10/4与过去五年、1980至2010年平均北极海冰面积曲线。灰色区域为四分位
距与十分位距。
![]()
Figure 2b. This image shows the departure from average sea level pressure in
millibars over the Arctic for June, July, and August in 2017. Yellows and
reds indicate higher than average pressures; blues and purples indicate lower
than average pressures.
图2b. 六至八月海平面气压距平分布,黄色与红色为正距平;蓝色与紫色为负距平。
September 2017 compared to previous years 2017年九月与过去比较
The linear rate of sea ice decline for September is 86,100 square kilometers
(33,200 square miles) per year, or 13.2 percent per decade relative to the
1981 to 2010 average. For comparison, the decline rate was calculated at 13.7
percent after the 2013 minimum, and 13.4 percent in 2016. Although sea ice
shows significant year-to-year variability, the overall trend of decline
remains strong.
1981至2010年九月海冰以每年8.61万平方公里(3.32万平方英里)速度,每十年13.2%比例
递减。此比例数字在2013年为13.7%,2016年为13.4%。虽然每年可能有变异,但大体趋势
是非常明显的。
![]()
Figure 3. Monthly September ice extent for 1979 to 2017 shows a decline of
13.2 percent per decade.
图3. 1979至2017年九月海冰面积呈现每十年13.2%比例递减。
Thickness and age trends in Arctic sea ice from models and data
北极海冰厚度与年龄
According to estimates from the University of Washington Polar Science Center
’s PIOMAS, which assimilates observational data into a coupled ice-ocean
model, sea ice volume was at record low levels from January through June of
2017. However, the generally cool summer conditions slowed the rate of ice
melt, and the ice volume for September ended up fourth lowest in the PIOMAS
record, above 2010, 2011, and 2012.
根据华盛顿大学极区科学中心PIOMAS模式,将过去海冰观测资料模型同步比较,海冰体积
在2017年一至六月创下历史新低。但凉夏环境减少消融速度,九月结算为历史第四低,仅
次于2010、2011、2012三年。
Another way to assess the volume of the ice, at least in a qualitative sense,
is through tracking sea ice age (Figure 4b). Older ice is generally thicker
ice. Over the satellite record, there has been a significant decline in
coverage of the oldest, thickest ice. While this year’s minimum sea ice
extent is higher than in 2016, the marginal gain can be largely attributed to
younger ice types: first-year ice (0 to 1 years old) and second-year ice (1
to 2 years old). The oldest ice, that which is over 4 years old, is only
slightly higher than last year and remains almost non-existent within the
Arctic. At the minimum this year, ice older than 4 years constituted only
~150,000 square kilometers (~58,000 square miles), compared to over 2 million
square kilometers (~770,000 square miles) during the mid-1980s.
另一个至少在定性层面推估海冰体积的方式为海冰年龄追踪。老冰通常较厚。根据卫星纪
录,老冰和厚冰呈现显著下降。虽然今年海冰最小面积高于去年,大多数归因于年轻的
冰:1岁的冰(0~1年)和2岁的冰(1~2年)。超过四年的老冰仅略微高于去年且并不在北
极海。今年最小面积时,超过四年的老冰仅有15万平方公里(5.8万平方英里),而1980年
中期为超过200万平方公里(77万平方英里)。
![]()
Figure 4a. This image from the Pan-Arctic Ice Ocean Modeling and Assimilation
System (PIOMAS) shows Arctic sea ice thickness departures from average
(anomaly) in meters for September 2017, relative to the 2000 to 2015 average.
Reds indicate thicker than average ice; blues indicate thinner than average
ice.
图4a. PIOMAS显示与2000至2015年平均相比,2017年九月厚冰已偏离北极海。红色为厚于
平均;蓝色为薄于平均。
![]()
Figure 4b. Sea ice age distribution at the annual minimum extent for 1985
(upper left) and 2017 (upper right). Time series (bottom) of different age
categories the minimum extent for 1985 to 2017. Note that the ice age product
does not include ice in the Canadian Archipelago. Data from Tschudi et al.,
EASE-Grid Sea Ice Age, Version 3
图4b. 1985年(左上)与2017年(右上)最小面积时海冰年龄分布。1985年至2017年海冰
年龄分布的时间序列(下图)。须注意此图不包含北极群岛的冰。
Antarctic maximum extent 南极海冰达到最大值
Antarctic sea ice may have reached its maximum extent on September 15, at
17.98 million square kilometers (6.94 million square miles), among the
earliest maxima on record. If this date and extent hold, it will be the
second-lowest daily maximum in the satellite record, 20,000 square kilometers
(7,700 square miles) above 1986. Antarctic sea ice extent has been at record
or near-record lows since September 2016. A series of recent studies have
explored causes of the sudden decline in extent that occurred in austral late
winter and spring of 2016. Most studies conclude that an unusual period of
strong meridional winds—consistent with a very pronounced negative phase of
the Southern Annular Mode index, coupled with a significant ‘wave-3 pattern’
in the atmospheric circulation—were the cause. A ‘wave-3 pattern’ refers
to a tendency for circulation around the southern continent to resemble a
three-leaf clover, rather than the more typical near-zonal (along lines of
longitude) pattern.
南极海冰可能已在9/15达到最大面积,1798万平方公里(694万平方英里)。如果未来没有
特殊变化,将会是历史第二低,比1986年多了2万平方公里(7700平方英里)。过了9/16,
海冰面积一直将近或已创下同期新低。一系列的研究显示可能是由于2016年澳洲较晚入冬
与入春导致。
![]()
Figure 5. The graph above shows Antarctic sea ice extent as of October 4,
2017, along with daily ice extent data for 2017 (aqua), 2016 (red), 2013
(dotted green), and 1986 (yellow). The 1981 to 2010 median is in dark gray.
The gray areas around the median line show the interquartile and interdecile
ranges of the data. Sea Ice Index data.
图5. 至2017/10/4与过去五年、1980至2010年平均南极海冰面积曲线。灰色区域为四分位
距与十分位距。
P.S. 后面的部分牵涉到不少专有名词,为了避免翻译谬误误导板友,故仅附上原文,
欢迎各位本科系的板友对后面的内容进行解释。
The Maud Rise polynya, discussed in our last post, continues to grow and is
now at about 35,000 square kilometers (14,000 square miles). A recent study
(see Further reading, below) discusses how its formation is related to
climate patterns and natural variability, and that the recent reappearance
supports a forecast by an updated climate model.
Driftwood and long-term changes in Arctic ice movement
While the satellite record has been key in documenting large declines in the
Arctic sea ice cover during the past four decades, the data record is still
relatively short. To provide a longer record, scientists turn to the geologic
record and proxy data. One approach is to analyze the age, transport, and
deposition of driftwood. Driftwood distribution depends strongly on past sea
ice conditions and ocean currents. New research using 913 driftwood samples
collected across the western Arctic (Figure 6) has shed new insight on sea
ice changes during the Holocene, between 12,000 years ago to present. During
the early Holocene (12,000 to 8,000 years ago), the analysis suggests that
the clockwise Beaufort Gyre dominated Arctic Ocean circulation, allowing more
sea ice to stay within the Arctic Ocean. In the mid-Holocene (8,000 to 4,000
years ago), temperatures were higher and the Transpolar Drift dominated,
leading to more ice export out of the Arctic Ocean through Fram Strait and
less sea ice in the Arctic Ocean. In the late Holocene (4,000 years ago to
present), the Beaufort Gyre once again strengthened as temperatures slowly
cooled until the most recent several decades.
https://goo.gl/GudGtA
Figure 6. The maps show two modes of wintertime Arctic sea ice circulation
patterns. (a) shows the Low Arctic Oscillation (AO) index has a strong
Beaufort Gyre which supports ice re-circulation within the Arctic. (b) shows
the High AO index in which the Beaufort Gyre is weak and the Transpolar Drift
expands, leading to Arctic ice exported in a shorter time interval. Bold
numbers show the average time in years for ice starting from various
locations to be exported through Fram Strait under the illustrated patterns.
The red dashed lines encircle the region of ice recirculation and persistence
(Rigor et al., 2002). Over continents, light blue lines show watersheds with
named major rivers (shown as bold blue lines) that export driftwood into the
Arctic Ocean. Green letters indicate driftwood sample regions: CAA, Canadian
Arctic Archipelago; EG, East Greenland; JM, Jan Mayen; NG, North Greenland;
FJL, Franz Josef Land; NZ, Novaya Zemlya; SB, Svalbard. Circulation patterns
compiled and modified from Rigor et al. (2002).
资料来源:美国国家冰雪资料中心
最后更新日期:2017/10/5
Arctic sea ice 2017: Tapping the brakes in September
北极海冰2017现况:融冰速度踩煞车的九月
After setting a record low seasonal maximum in early March, Arctic sea ice
extent continued to track low through July. However, the rate of ice loss
slowed in August and September. The daily minimum extent, reached on
September 13, was the eighth lowest on record, while the monthly average
extent was seventh lowest. In Antarctica, sea ice extent may have reached its
annual winter maximum.
北极海冰在三月初达到破纪录新低的最大面积后,开始稳定缩减至七月。然而在八到九月
北极海冰消融的速度放缓,在9/13达到最小面积(此为历史第八低,而九月平均面积为历
史第七低)。在南极,海冰面积可能已达到冬天最大值。
Overview of conditions 现况概述
Arctic sea ice extent for September 2017 averaged 4.87 million square
kilometers (1.88 million square miles), the seventh lowest in the 1979 to
2017 satellite record. This was 1.67 million square kilometers (645,000
square miles) below the 1981 to 2010 average, and 1.24 million square
kilometers (479,000 square miles) above the record low September set in 2012.
北极海冰面积九月平均为487万平方公里(188万平方英里),为自1979年以来历史第七
低。和1981至2010平均相比少了167万平方公里(64.5万平方英里),而比历史最低的2012
年九月多了124万平方公里(47.9万平方英里)。
After reaching the minimum on September 13 (eighth lowest on record), extent
initially increased slowly (about 20,000 square kilometers, or 8,000 square
miles, per day). However, starting September 26 and persisting through the
end of the month, ice growth rates increased to about 60,000 square
kilometers (23,000 square miles) per day. During the second half of the
month, extent increased in all sectors except in the Beaufort Sea, where some
local ice retreat persisted. The most rapid growth occurred along the
Siberian side of the Arctic Ocean, where the ice edge advanced as much as 150
kilometers (90 miles) over the latter half of September. At the end of
September, the ice edge in the Beaufort and Chukchi Seas remained
considerably further north than is typical.
在9/13达到(历史第八低的)最小面积后,北极海冰面积开始(以约每天2万平方公里,
8000平方英里速度)缓慢增加。但是从9/26开始至月底,速度加快至每天6万平方公里(
2.3万平方英里)。在后半月,除了波佛特海仍有冰层消退,其余地方结冰面积皆开始增
加。西伯利亚是增加最快的地方,冰层边缘长度在后半月增加将近150公里(90英里)。
在九月底,波特佛海和楚科奇海的冰层边缘离正常位置仍北了许多。
https://goo.gl/kEwJr5
Near-record open water reported in Beaufort and Chukchi seas
波佛特海和楚科奇海的未结冰水域面积已逼近历史纪录
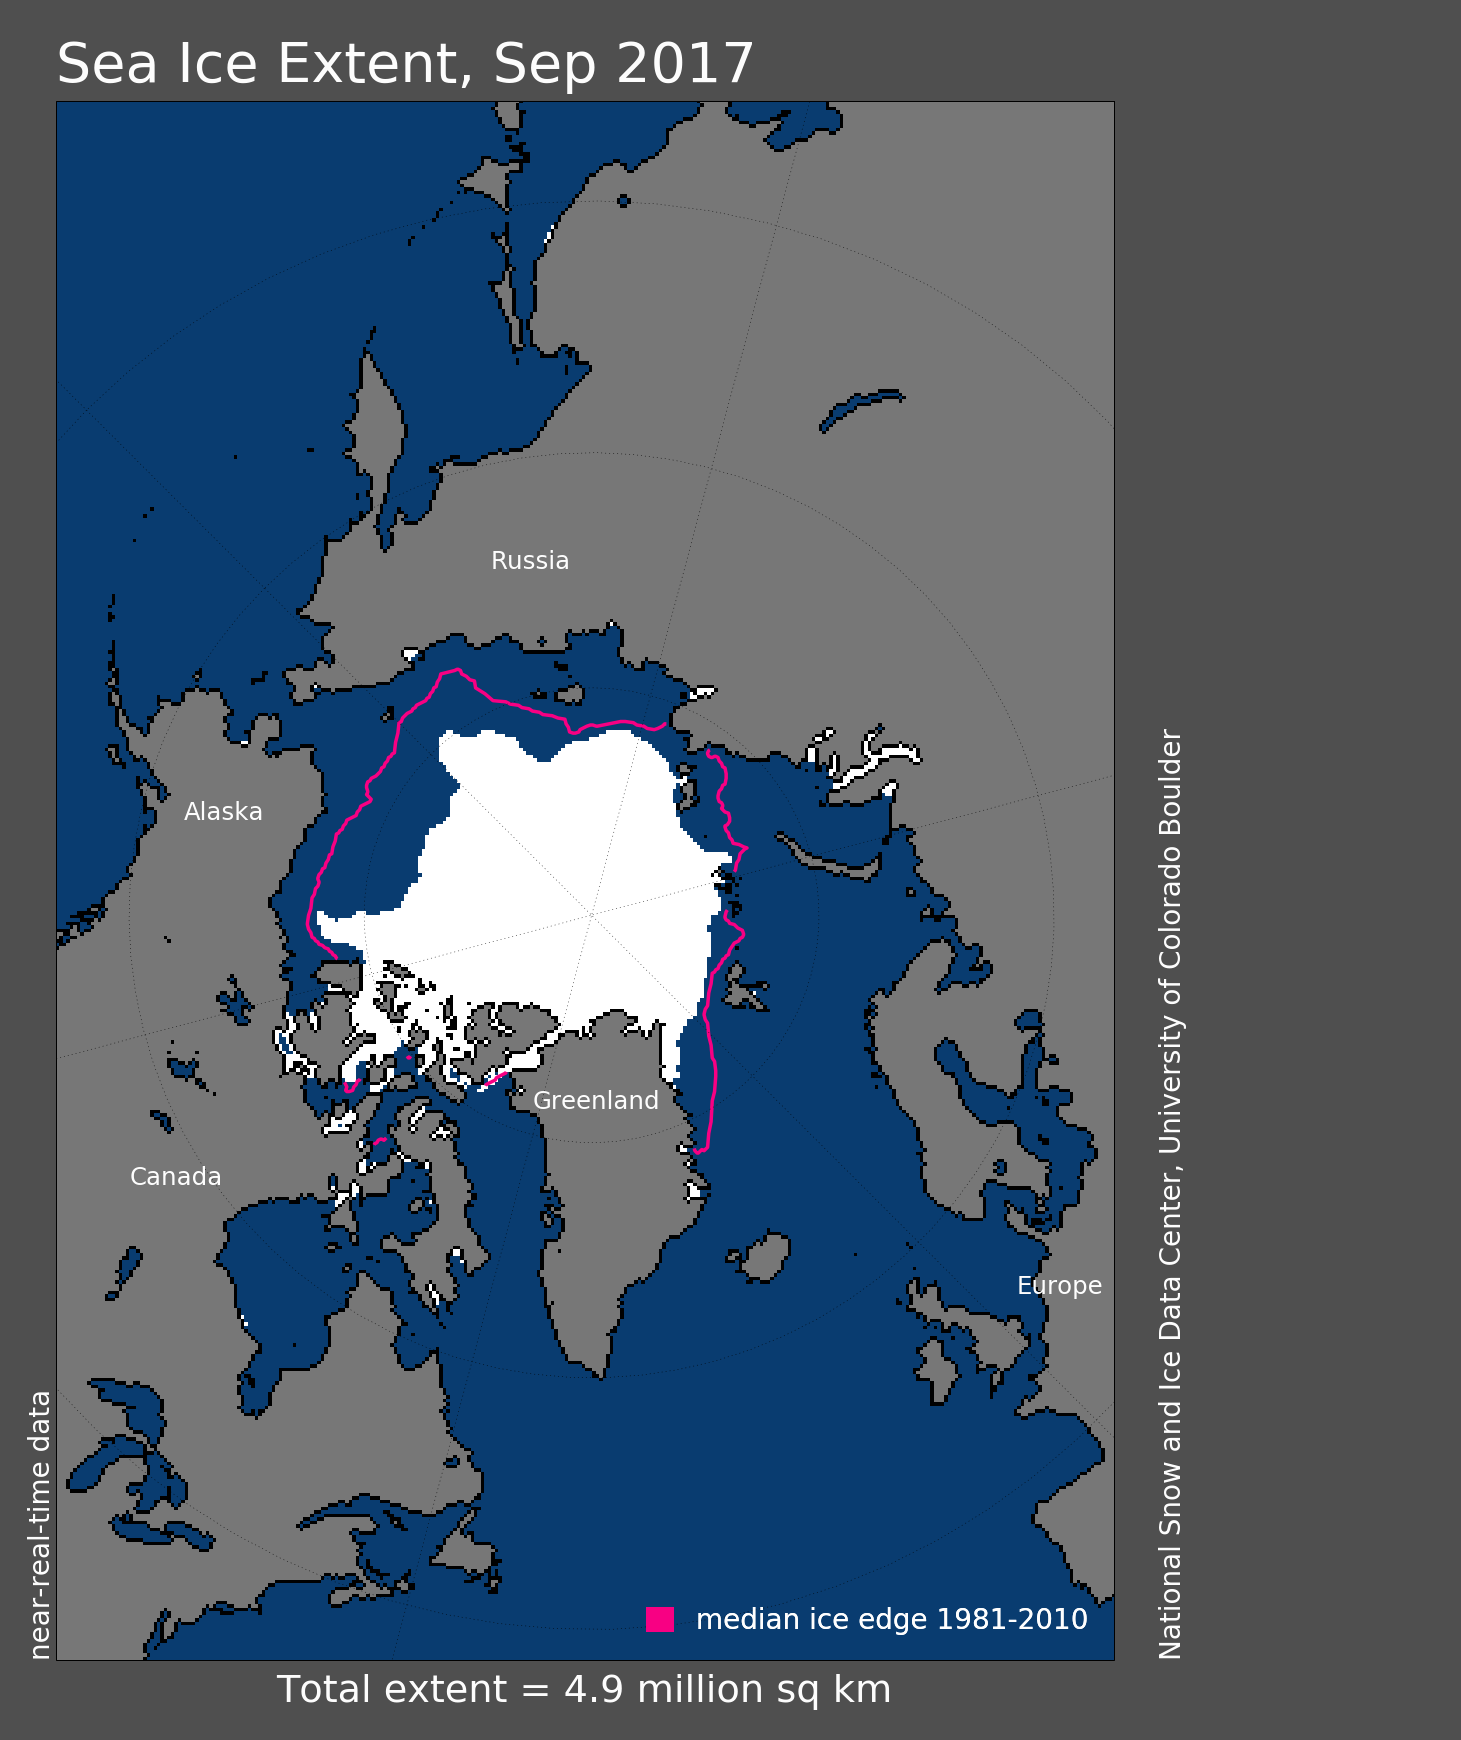
Figure 1. Arctic sea ice extent for September 2017 was 4.87 million square
kilometers (1.88 million square miles). The magenta line shows the 1981 to
2010 average extent for that month. Sea Ice Index data. About the data
图1. 北极海冰面积在九月为487万平方公里(188万平方英里)。红紫色为1981至2010九月
同期的平均面积。
Conditions in context 详细现况
September air temperatures at the 925 hPa level (approximately 2,500 feet
above sea level) were above average over much of the Arctic Ocean.
Temperatures ranged from 5 degrees Celsius (9 degrees Fahrenheit) above the
1981 to 2010 long term average in the far northern Atlantic east of
Greenland, to 1 to 2 degrees Celsius (2 to 4 degrees Fahrenheit) above the
reference period in the western Arctic. Cooler conditions (1 degree Celsius
or 2 degrees Fahrenheit below average) were present in Baffin Bay. Part of
the above average temperatures over the coastal areas of the Arctic Ocean and
in the northern North Atlantic likely results from heat fluxes from open
water.
北极海多数地方九月925百帕层(约海拔2500英呎)的温度皆高于平均。格陵兰东北方海域
比1981至2010年平均高了摄氏5度(华氏9度),北极海西部高了摄氏1~2度(华氏2~4
度)。巴芬湾则为负距平(低了摄氏1度,华氏2度)。在北极海与北大西洋北方部分区域
的正距平造成热通量进而导致仍有未结冻水域的产生。
Looking back at this past summer (June through August), air temperatures at
the 925 hPa level averaged for June through August were near or below the
1981 to 2010 average over much of the Arctic Ocean, notably along the
Siberian side centered over the Laptev Sea (1 degree Celsius or 1.8 degrees
Fahrenheit below the 1981 to 2010 average). By contrast, temperatures were
slightly above average over much of the East Siberian, Chukchi and Beaufort
Seas (1 degree Celsius, or 1.8 degrees Fahrenheit above average).
六至八月,925百帕层的温度将近或低于1981至2010年平均,特别是在西伯利亚的拉普捷夫
海(低于摄氏1度,华氏1.8度)。相对地,东西伯利亚、波佛特海与楚科奇海则略高于平
均(摄氏1度,华氏1.8度)。
Like 2016, the summer of 2017 was characterized by persistently stormy
patterns over the central Arctic Ocean, reflected in the summer average sea
level pressure field (Figure 2b) as an area of low pressure centered just
south of the North Pole in the Siberian sector of the Arctic. As has been
shown in past studies, low pressure systems found over the central Arctic
Ocean in summer are typically “cold cored.” This helps to explain the cool
summer temperatures noted above. The cyclonic (counterclockwise) winds
associated with the stormy pattern also tend to spread out the sea ice. Both
processes likely helped to slow sea ice loss this summer.
如同2016年,2017年夏天北极海中心为暴风型,反映出夏天平均环境场为低压中心,除了
北极海南部的西伯利亚扇形区域。过去研究显示,低压环境场在夏天常为典型冷源。这帮
助解释凉夏的原因。逆时针环流除了和暴风型态有关也有助于扩张海冰。两者都可能帮助
减缓夏天海冰消融速度。

Figure 2a. The graph above shows Arctic sea ice extent as of October 4, 2017,
along with daily ice extent data for five previous years. 2017 is shown in
blue, 2016 in green, 2015 in orange, 2014 in brown, 2013 in purple, and 2012
in dotted brown. The 1981 to 2010 median is in dark gray. The gray areas
around the median line show the interquartile and interdecile ranges of the
data. Sea Ice Index data.
图2a. 至2017/10/4与过去五年、1980至2010年平均北极海冰面积曲线。灰色区域为四分位
距与十分位距。
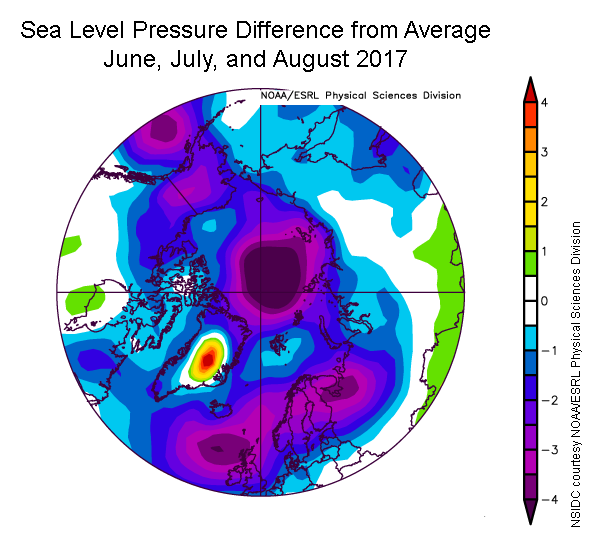
Figure 2b. This image shows the departure from average sea level pressure in
millibars over the Arctic for June, July, and August in 2017. Yellows and
reds indicate higher than average pressures; blues and purples indicate lower
than average pressures.
图2b. 六至八月海平面气压距平分布,黄色与红色为正距平;蓝色与紫色为负距平。
September 2017 compared to previous years 2017年九月与过去比较
The linear rate of sea ice decline for September is 86,100 square kilometers
(33,200 square miles) per year, or 13.2 percent per decade relative to the
1981 to 2010 average. For comparison, the decline rate was calculated at 13.7
percent after the 2013 minimum, and 13.4 percent in 2016. Although sea ice
shows significant year-to-year variability, the overall trend of decline
remains strong.
1981至2010年九月海冰以每年8.61万平方公里(3.32万平方英里)速度,每十年13.2%比例
递减。此比例数字在2013年为13.7%,2016年为13.4%。虽然每年可能有变异,但大体趋势
是非常明显的。
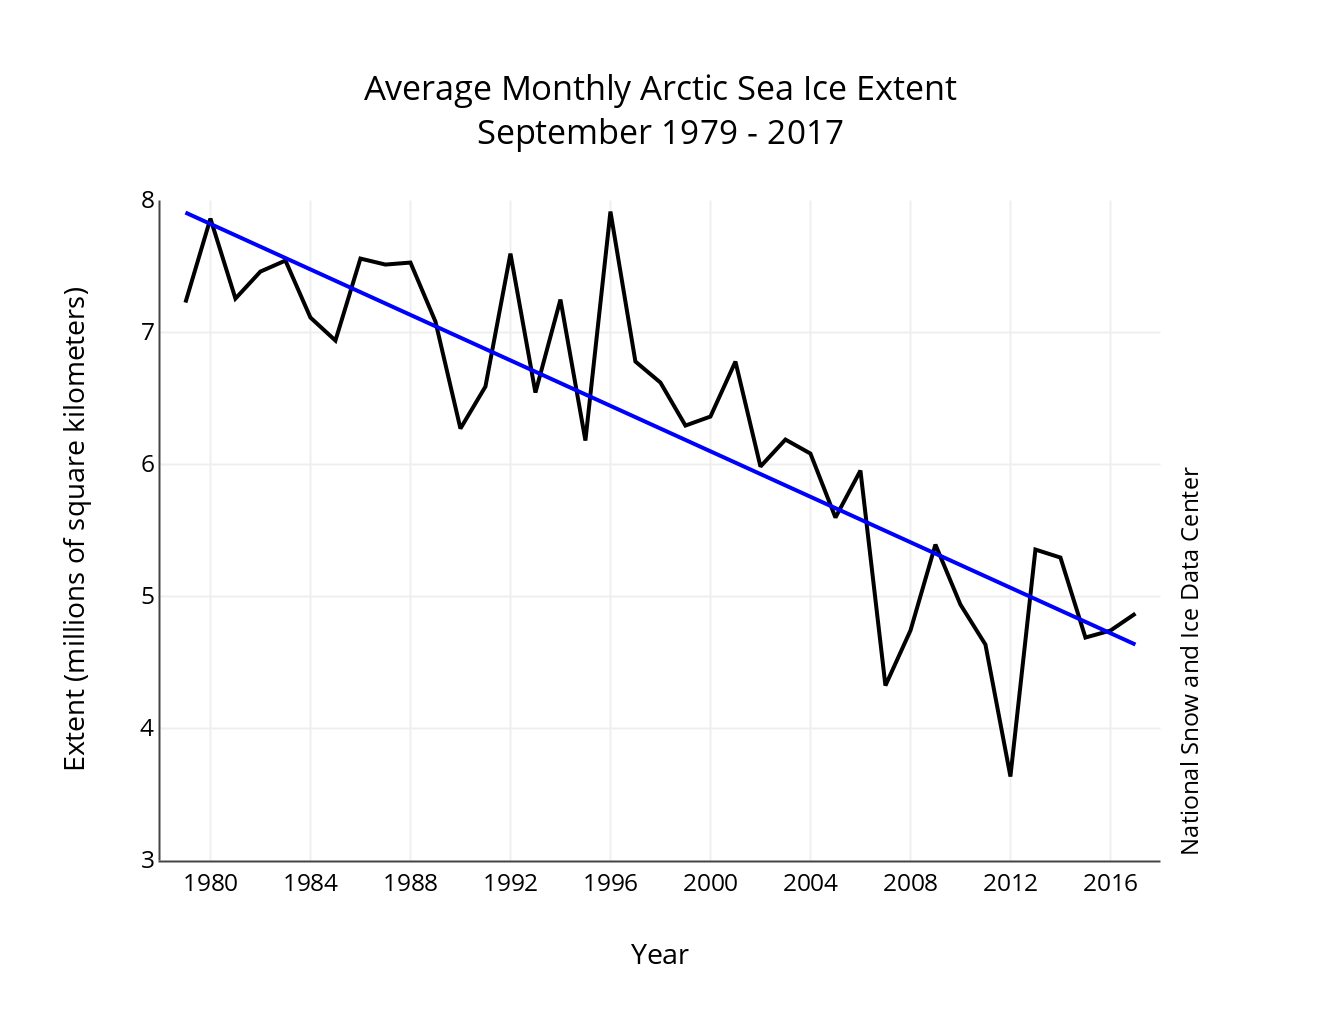
Figure 3. Monthly September ice extent for 1979 to 2017 shows a decline of
13.2 percent per decade.
图3. 1979至2017年九月海冰面积呈现每十年13.2%比例递减。
Thickness and age trends in Arctic sea ice from models and data
北极海冰厚度与年龄
According to estimates from the University of Washington Polar Science Center
’s PIOMAS, which assimilates observational data into a coupled ice-ocean
model, sea ice volume was at record low levels from January through June of
2017. However, the generally cool summer conditions slowed the rate of ice
melt, and the ice volume for September ended up fourth lowest in the PIOMAS
record, above 2010, 2011, and 2012.
根据华盛顿大学极区科学中心PIOMAS模式,将过去海冰观测资料模型同步比较,海冰体积
在2017年一至六月创下历史新低。但凉夏环境减少消融速度,九月结算为历史第四低,仅
次于2010、2011、2012三年。
Another way to assess the volume of the ice, at least in a qualitative sense,
is through tracking sea ice age (Figure 4b). Older ice is generally thicker
ice. Over the satellite record, there has been a significant decline in
coverage of the oldest, thickest ice. While this year’s minimum sea ice
extent is higher than in 2016, the marginal gain can be largely attributed to
younger ice types: first-year ice (0 to 1 years old) and second-year ice (1
to 2 years old). The oldest ice, that which is over 4 years old, is only
slightly higher than last year and remains almost non-existent within the
Arctic. At the minimum this year, ice older than 4 years constituted only
~150,000 square kilometers (~58,000 square miles), compared to over 2 million
square kilometers (~770,000 square miles) during the mid-1980s.
另一个至少在定性层面推估海冰体积的方式为海冰年龄追踪。老冰通常较厚。根据卫星纪
录,老冰和厚冰呈现显著下降。虽然今年海冰最小面积高于去年,大多数归因于年轻的
冰:1岁的冰(0~1年)和2岁的冰(1~2年)。超过四年的老冰仅略微高于去年且并不在北
极海。今年最小面积时,超过四年的老冰仅有15万平方公里(5.8万平方英里),而1980年
中期为超过200万平方公里(77万平方英里)。
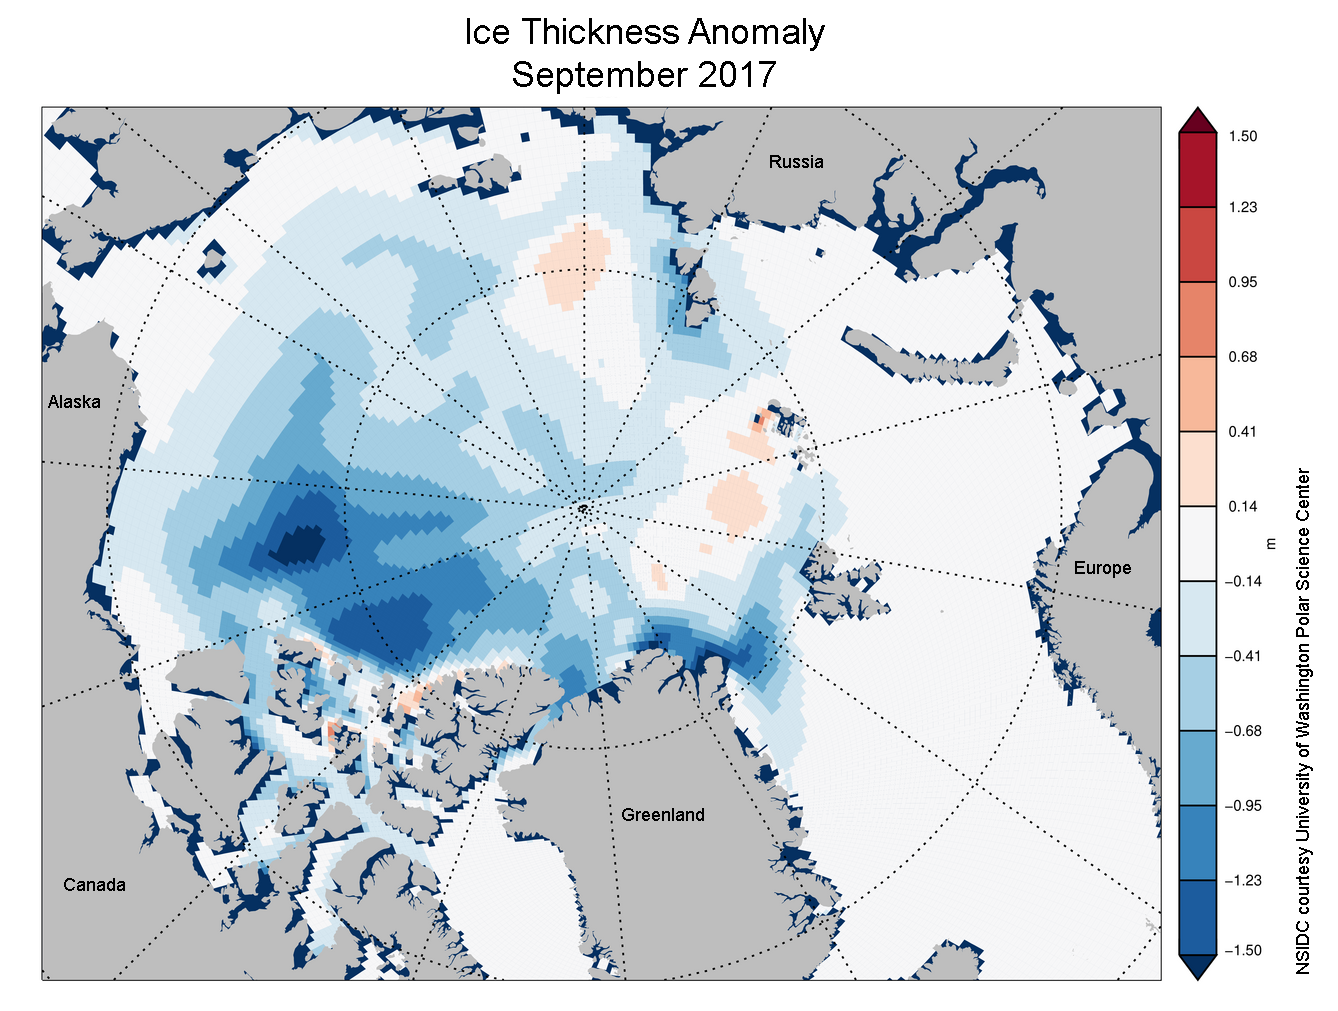
Figure 4a. This image from the Pan-Arctic Ice Ocean Modeling and Assimilation
System (PIOMAS) shows Arctic sea ice thickness departures from average
(anomaly) in meters for September 2017, relative to the 2000 to 2015 average.
Reds indicate thicker than average ice; blues indicate thinner than average
ice.
图4a. PIOMAS显示与2000至2015年平均相比,2017年九月厚冰已偏离北极海。红色为厚于
平均;蓝色为薄于平均。
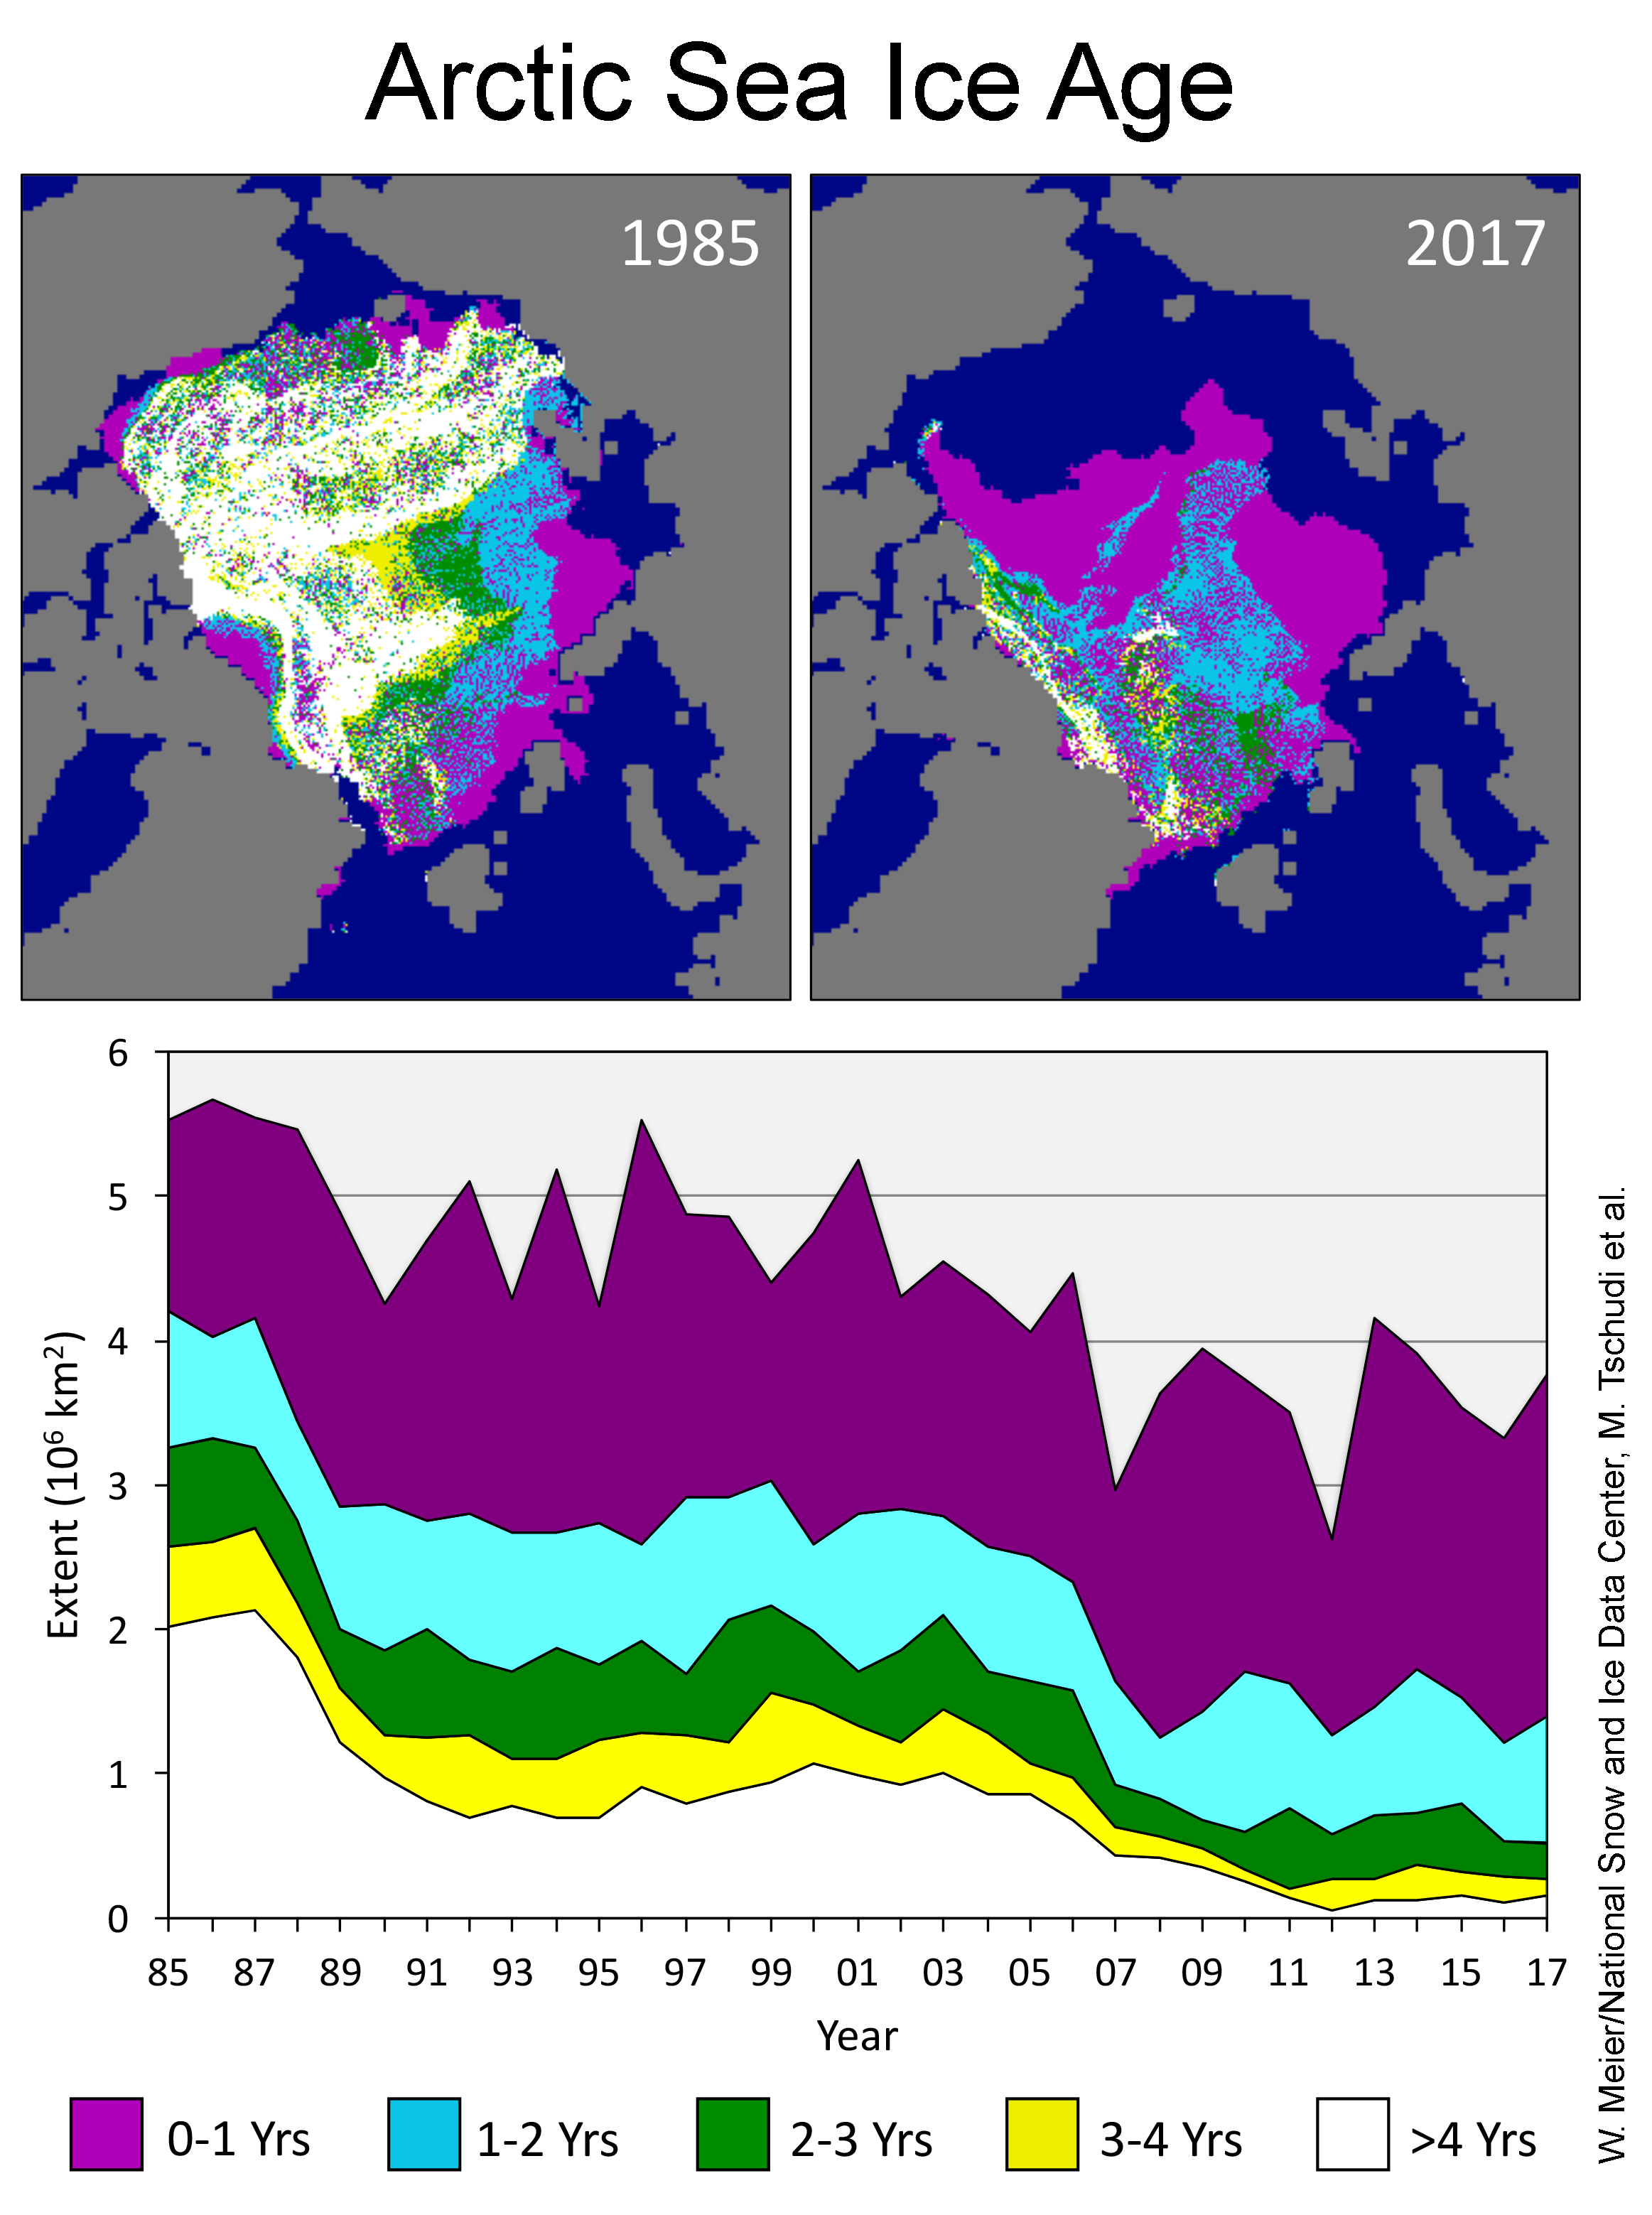
Figure 4b. Sea ice age distribution at the annual minimum extent for 1985
(upper left) and 2017 (upper right). Time series (bottom) of different age
categories the minimum extent for 1985 to 2017. Note that the ice age product
does not include ice in the Canadian Archipelago. Data from Tschudi et al.,
EASE-Grid Sea Ice Age, Version 3
图4b. 1985年(左上)与2017年(右上)最小面积时海冰年龄分布。1985年至2017年海冰
年龄分布的时间序列(下图)。须注意此图不包含北极群岛的冰。
Antarctic maximum extent 南极海冰达到最大值
Antarctic sea ice may have reached its maximum extent on September 15, at
17.98 million square kilometers (6.94 million square miles), among the
earliest maxima on record. If this date and extent hold, it will be the
second-lowest daily maximum in the satellite record, 20,000 square kilometers
(7,700 square miles) above 1986. Antarctic sea ice extent has been at record
or near-record lows since September 2016. A series of recent studies have
explored causes of the sudden decline in extent that occurred in austral late
winter and spring of 2016. Most studies conclude that an unusual period of
strong meridional winds—consistent with a very pronounced negative phase of
the Southern Annular Mode index, coupled with a significant ‘wave-3 pattern’
in the atmospheric circulation—were the cause. A ‘wave-3 pattern’ refers
to a tendency for circulation around the southern continent to resemble a
three-leaf clover, rather than the more typical near-zonal (along lines of
longitude) pattern.
南极海冰可能已在9/15达到最大面积,1798万平方公里(694万平方英里)。如果未来没有
特殊变化,将会是历史第二低,比1986年多了2万平方公里(7700平方英里)。过了9/16,
海冰面积一直将近或已创下同期新低。一系列的研究显示可能是由于2016年澳洲较晚入冬
与入春导致。
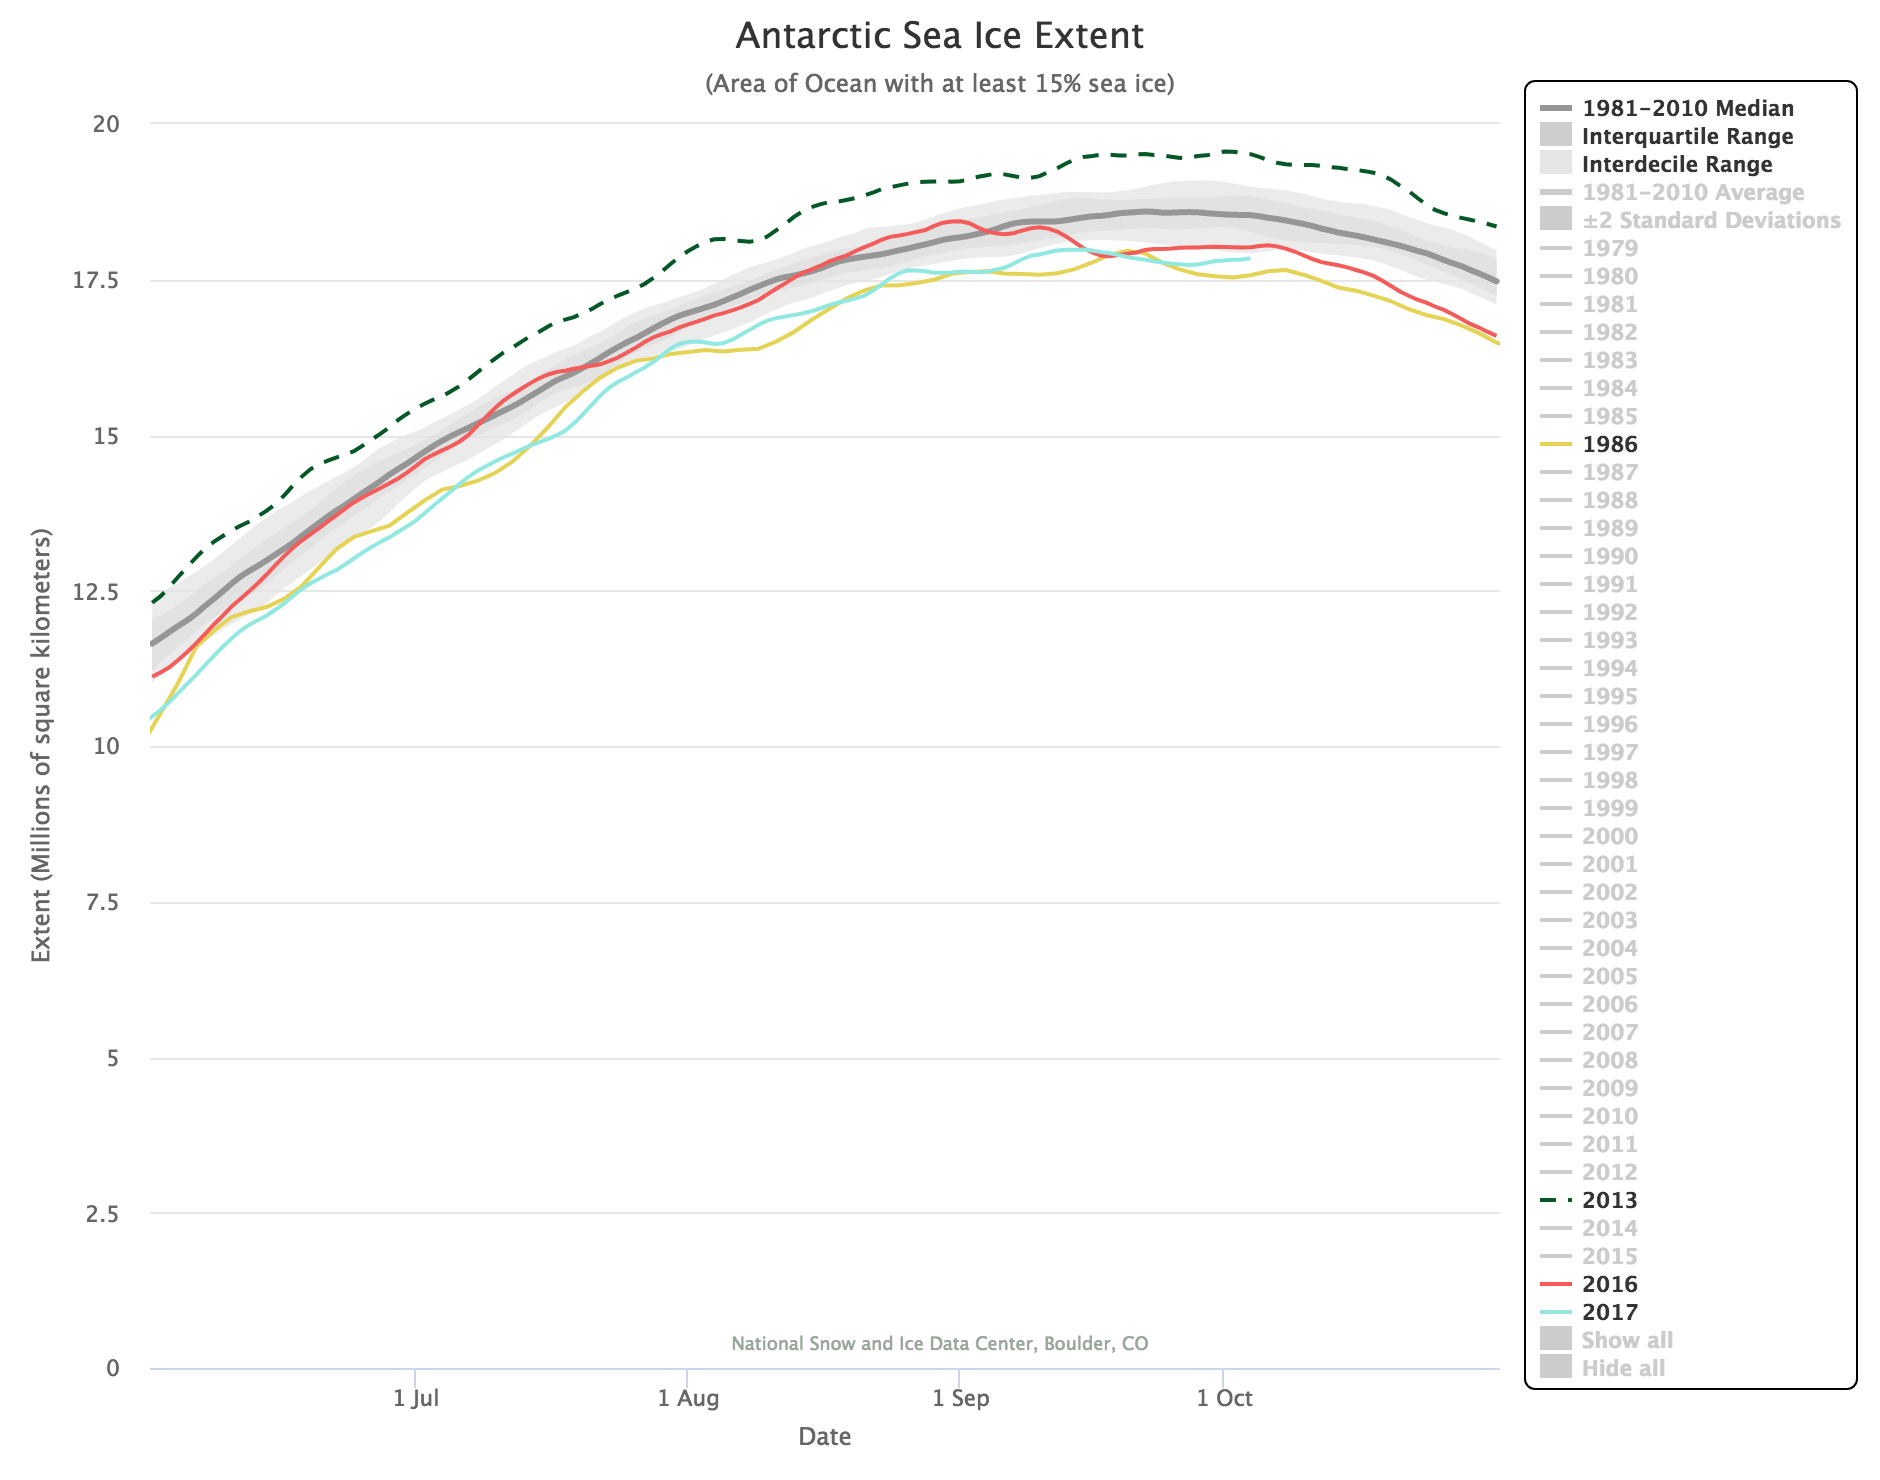
Figure 5. The graph above shows Antarctic sea ice extent as of October 4,
2017, along with daily ice extent data for 2017 (aqua), 2016 (red), 2013
(dotted green), and 1986 (yellow). The 1981 to 2010 median is in dark gray.
The gray areas around the median line show the interquartile and interdecile
ranges of the data. Sea Ice Index data.
图5. 至2017/10/4与过去五年、1980至2010年平均南极海冰面积曲线。灰色区域为四分位
距与十分位距。
P.S. 后面的部分牵涉到不少专有名词,为了避免翻译谬误误导板友,故仅附上原文,
欢迎各位本科系的板友对后面的内容进行解释。
The Maud Rise polynya, discussed in our last post, continues to grow and is
now at about 35,000 square kilometers (14,000 square miles). A recent study
(see Further reading, below) discusses how its formation is related to
climate patterns and natural variability, and that the recent reappearance
supports a forecast by an updated climate model.
Driftwood and long-term changes in Arctic ice movement
While the satellite record has been key in documenting large declines in the
Arctic sea ice cover during the past four decades, the data record is still
relatively short. To provide a longer record, scientists turn to the geologic
record and proxy data. One approach is to analyze the age, transport, and
deposition of driftwood. Driftwood distribution depends strongly on past sea
ice conditions and ocean currents. New research using 913 driftwood samples
collected across the western Arctic (Figure 6) has shed new insight on sea
ice changes during the Holocene, between 12,000 years ago to present. During
the early Holocene (12,000 to 8,000 years ago), the analysis suggests that
the clockwise Beaufort Gyre dominated Arctic Ocean circulation, allowing more
sea ice to stay within the Arctic Ocean. In the mid-Holocene (8,000 to 4,000
years ago), temperatures were higher and the Transpolar Drift dominated,
leading to more ice export out of the Arctic Ocean through Fram Strait and
less sea ice in the Arctic Ocean. In the late Holocene (4,000 years ago to
present), the Beaufort Gyre once again strengthened as temperatures slowly
cooled until the most recent several decades.
https://goo.gl/GudGtA
Figure 6. The maps show two modes of wintertime Arctic sea ice circulation
patterns. (a) shows the Low Arctic Oscillation (AO) index has a strong
Beaufort Gyre which supports ice re-circulation within the Arctic. (b) shows
the High AO index in which the Beaufort Gyre is weak and the Transpolar Drift
expands, leading to Arctic ice exported in a shorter time interval. Bold
numbers show the average time in years for ice starting from various
locations to be exported through Fram Strait under the illustrated patterns.
The red dashed lines encircle the region of ice recirculation and persistence
(Rigor et al., 2002). Over continents, light blue lines show watersheds with
named major rivers (shown as bold blue lines) that export driftwood into the
Arctic Ocean. Green letters indicate driftwood sample regions: CAA, Canadian
Arctic Archipelago; EG, East Greenland; JM, Jan Mayen; NG, North Greenland;
FJL, Franz Josef Land; NZ, Novaya Zemlya; SB, Svalbard. Circulation patterns
compiled and modified from Rigor et al. (2002).