Re: [问题] 折线图+长条图呈现
楼主: cd12631 (<(◥█◤△◥█◤)>) 2016-11-23 01:33:12
想看别种绘图吗?
plotly: 我这不是来了吗?
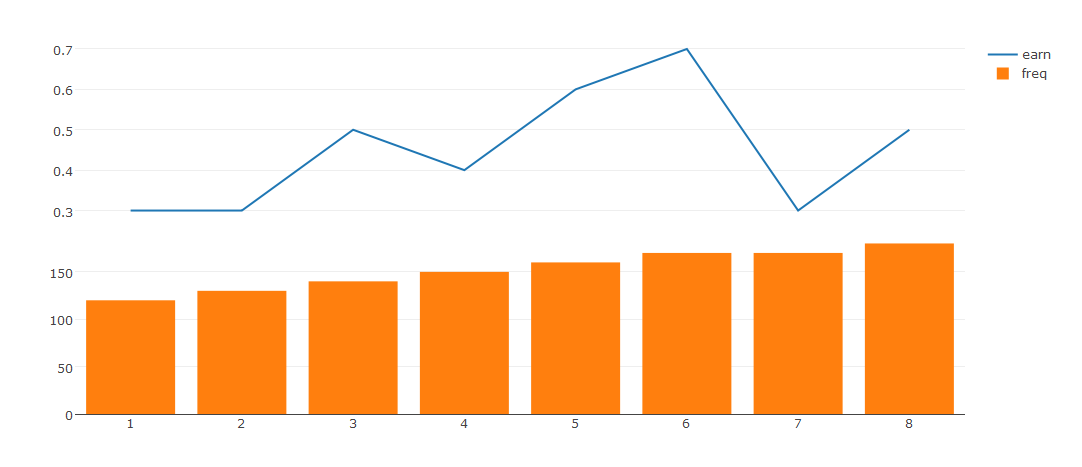
借用celestialgod的data frame作范例
library(plotly)
dt <- data.frame(
x = 1:8,
freq = c(120,130,140,150,160,170,170,180),
earn = c(3,3,5,4,6,7,3,5) * 0.1
)
dt_earn_plotly <- plot_ly(data = dt, x=dt$x, y=dt$earn, type = "scatter",
mode = "liners", name = "earn")
dt_freq_plotly <- plot_ly(data = dt, x=dt$x, y=dt$freq, type = "bar", name =
"freq")
dt_plotly <- subplot(dt_earn_plotly, dt_freq_plotly, nrows = 2, shareX =
TRUE)
dt_plotly
图:
![]()
互动接口: http://yichunsung.github.io/plotly
Code可能在Github上你会看得比较清楚:
https://github.com/yichunsung/R_Application/blob/master/plotly%20sample.R
plotly: 我这不是来了吗?
借用celestialgod的data frame作范例
library(plotly)
dt <- data.frame(
x = 1:8,
freq = c(120,130,140,150,160,170,170,180),
earn = c(3,3,5,4,6,7,3,5) * 0.1
)
dt_earn_plotly <- plot_ly(data = dt, x=dt$x, y=dt$earn, type = "scatter",
mode = "liners", name = "earn")
dt_freq_plotly <- plot_ly(data = dt, x=dt$x, y=dt$freq, type = "bar", name =
"freq")
dt_plotly <- subplot(dt_earn_plotly, dt_freq_plotly, nrows = 2, shareX =
TRUE)
dt_plotly
图:
互动接口: http://yichunsung.github.io/plotly
Code可能在Github上你会看得比较清楚:
https://github.com/yichunsung/R_Application/blob/master/plotly%20sample.R
作者: celestialgod (天) 2016-11-23 01:39:00
哈哈哈,推,真的有人刻了偷偷说偷懒的方法其实是直接把ggplot的图,加上ggplotly就好
作者: samex4x4 (Same) 2016-11-23 09:54:00
出现第四个套件啦XDD 真的好多画法啊
作者: clansoda (小笨) 2016-11-23 11:09:00
plotly比较fancy,而且用ggplot的语法就能实现端看个人喜好XDD,漂亮的大家都爱阿
作者: andrew43 (讨厌有好心推文后删文者) 2016-11-23 19:14:00
现在是在集七龙珠吗?
作者: locka (locka) 2016-11-23 23:02:00
可以借机请教cd12631大大怎么把图放到github.io上的吗?谢谢cd大!! 我试成功了,感谢!
继续阅读
[问题] 如何在自己的服务器上建立R-leaflet套件lovealbee[问题] shiny io 中文显示问题samex4x4[问题] glmmPQL无法收敛问题ppp1987[问题] 无法用shiny server执行leaflet套件rlearner[问题] (救回) loop in analysiscelestialgod[问题] (救回) loop 中 cell 内细格等于变项celestialgod[问题] (救回) 如何读入多个CSV档celestialgod[问题] (救回) find & substr 在r的应用celestialgodRe: 呼吁:有板友推文回应后请尽量不要删除原文celestialgod[问题] (救回) 多回圈loop 与paste celestialgod